Key Enhancements

Reporting and Analytics
- This release has new support for Tabular and Summary reporting. Reports are similar in functionality to List Views but Reports also offer:
- Cross-Entity functionality
- Filtering, grouping, and summarizing records
- Compatibility with Dashboards
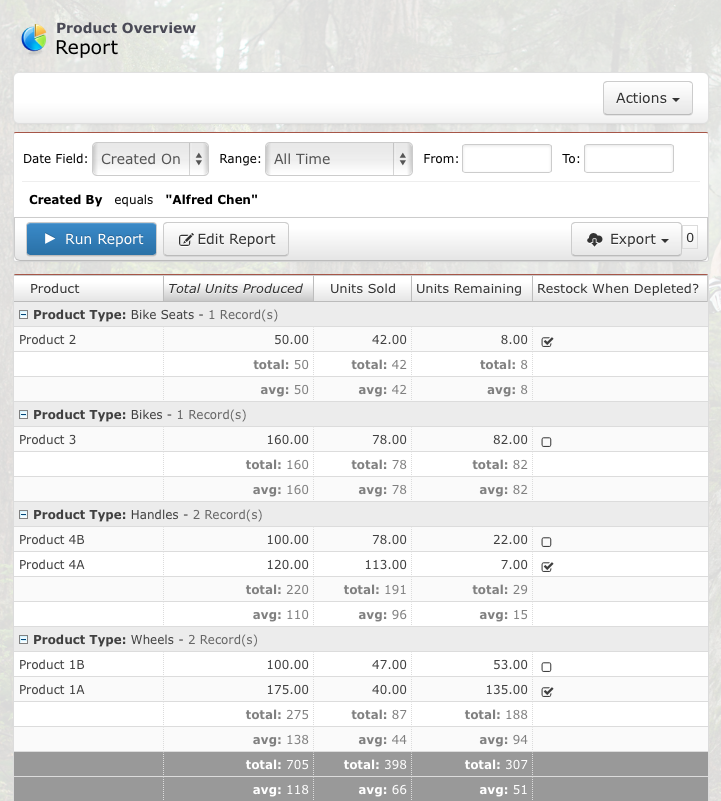
- A new Report Builder allows users to quickly create reports on any Entity as well as related Entities (lookup and Master-detail). Filters, sorting and grouping by fields are also supported. Users can select columns or subgroups to be summarized. Reports can also be printed and exported.
Dashboards
- A new Dashboard Designer makes it easy for users to create great-looking Dashboards with charts and graph components including Horizontal Bar, Vertical Bar, Line, Pie, Donut, Funnel, Scatter, Gauge, Table and Heat Map.
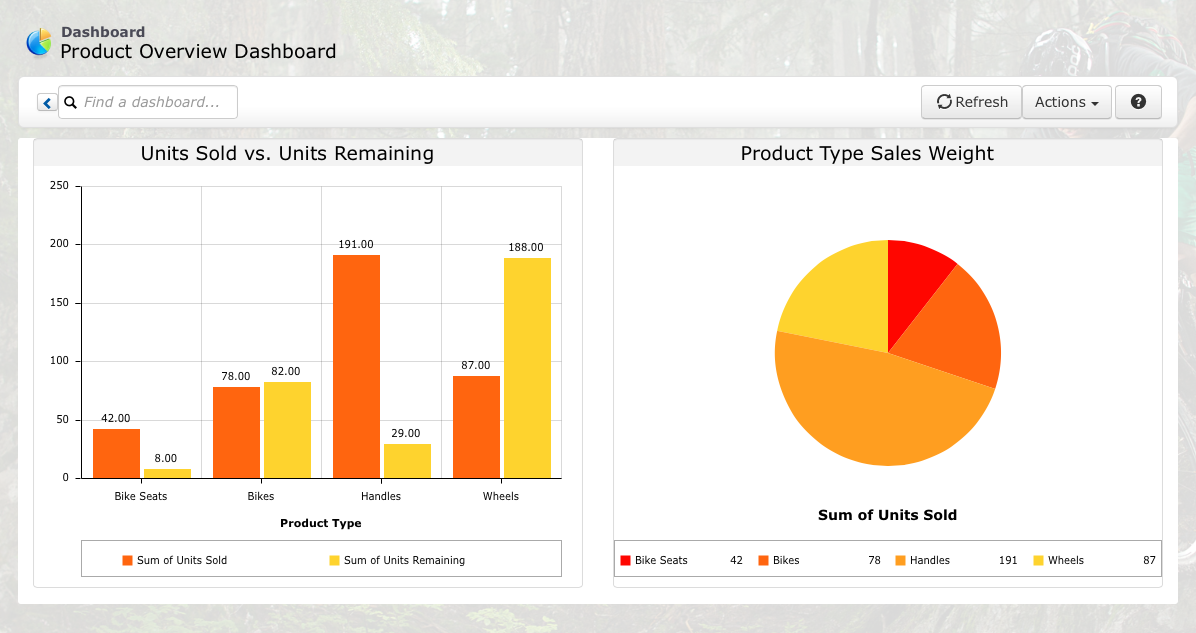
- Custom Active Page components can also be used in Dashboards to extend the functionality of Dashboards as needed. Developers can now use a Dashboard Viewer component in their custom Active Pages.
- Components can be enhanced with Titles, Header and Footer text and can be customized with background and font colors.
Custom Labels
- Developers can now create text labels which can be used in Active Pages, that are made available for translation in the Translation Studio.
Field Picker
- A new dialog for field selection from multiple levels makes it easier to create Formula Fields, Automation formulas, email templates, custom buttons and more throughout the platform.
Document Library
- Administrators now can set the default sorting of the documents and sub-folders as well as turn off Social Collaboration on documents in a folder.
- Newly created Formula Fields now support filtering, sorting, and searching.
Tabs
- This new feature fits the tabs into one row and folds the extra ones into a dropdown menu as the screen resizes. This feature also removes the tab size limitation of a maximum of 12.